Jump to
Related Content
Here are the Group Income Statements of the consolidated financial statements of Temasek and its subsidiaries for the financial year ended 31 March 2018.
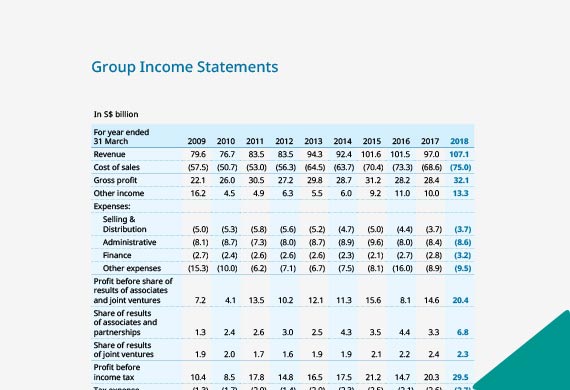
Group Income Statements
Read moreHere are the Group Cash Flow Statements of the consolidated financial statements of Temasek and its subsidiaries for the financial year ended 31 March 2018.
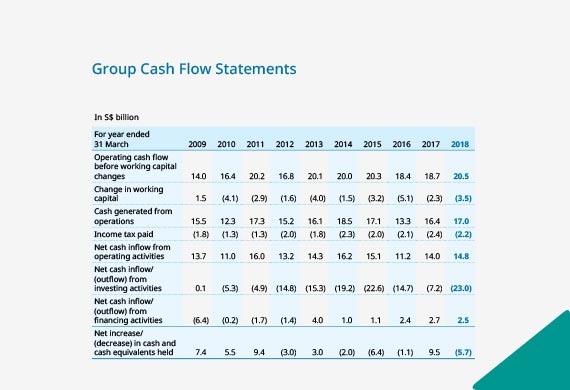
Group Cash Flow Statements
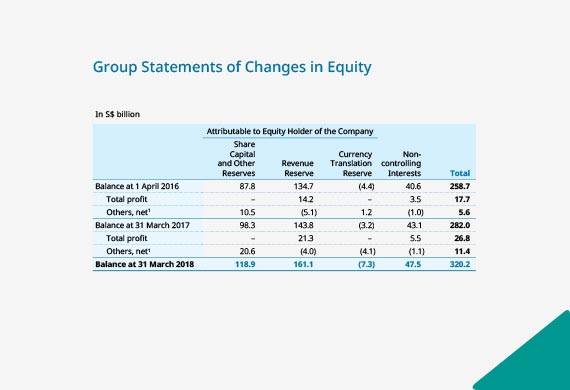
Read moreHere are the Group Statements of Changes in Equity of the consolidated financial statements of Temasek and its subsidiaries for the financial year ended 31 March 2018.