Jump to
Performance Overview
We delivered a net portfolio value of S$308 billion.
(as at 31 March)
S$308b
Net portfolio value
Up S$33 billion from last year
Net Portfolio Value (S$b)

S$29b
Invested during the year
Invested S$203 billion over the last decade
Investments & Divestments (S$b)
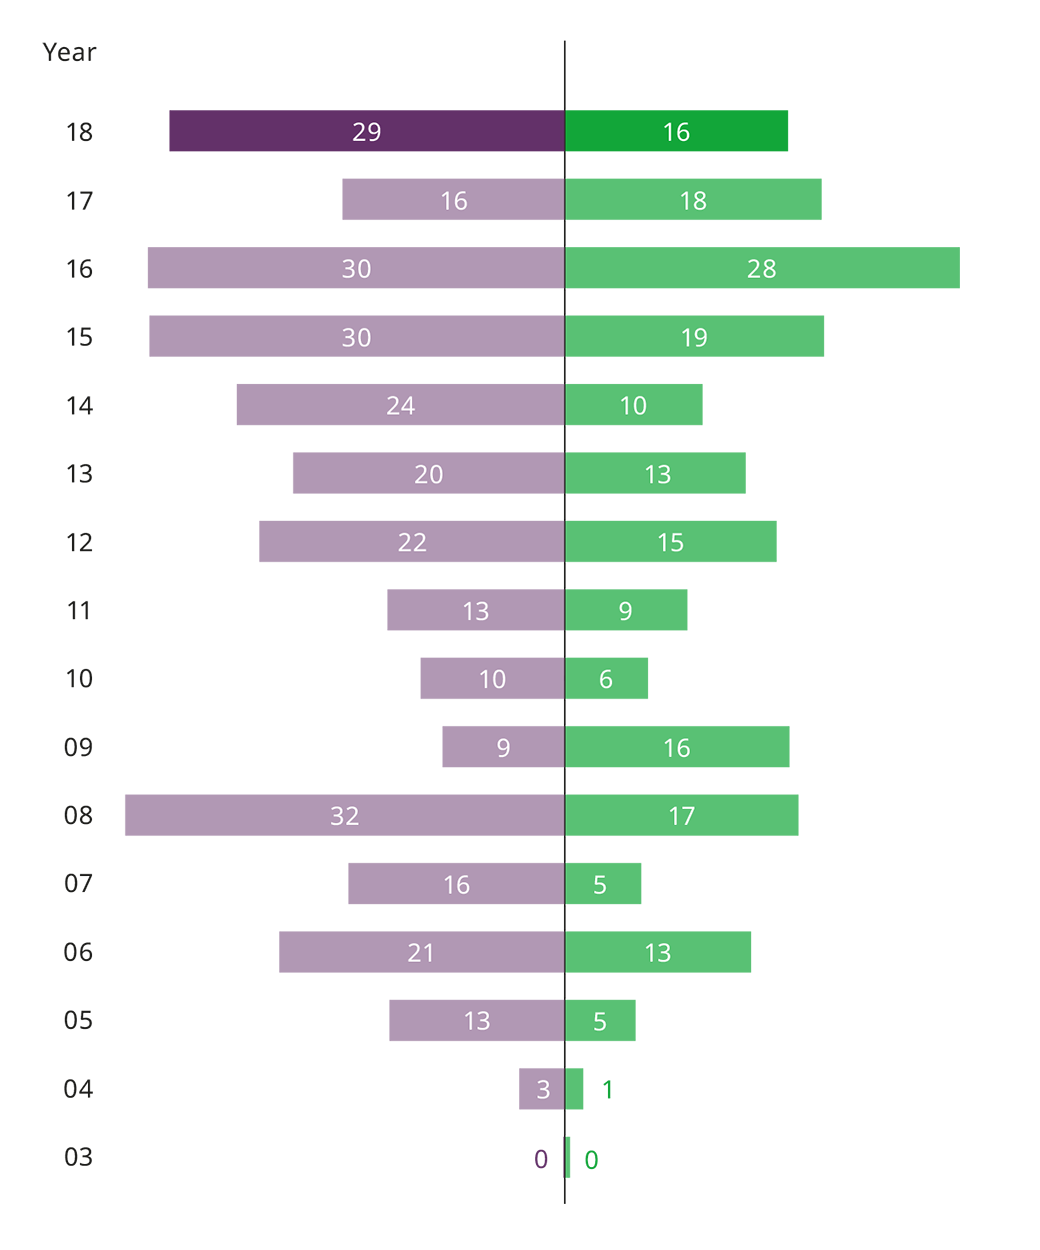
- Investments
- Divestments
68%
Exposure to Asia
Singapore exposure up S$22 billion over the last 10 years
Portfolio by Geography (%)
| 90 | 103 | 129 | 164 | 185 | 130 | 186 | 193 | 198 | 215 | 223 | 266 | 242 | 275 | 308 |
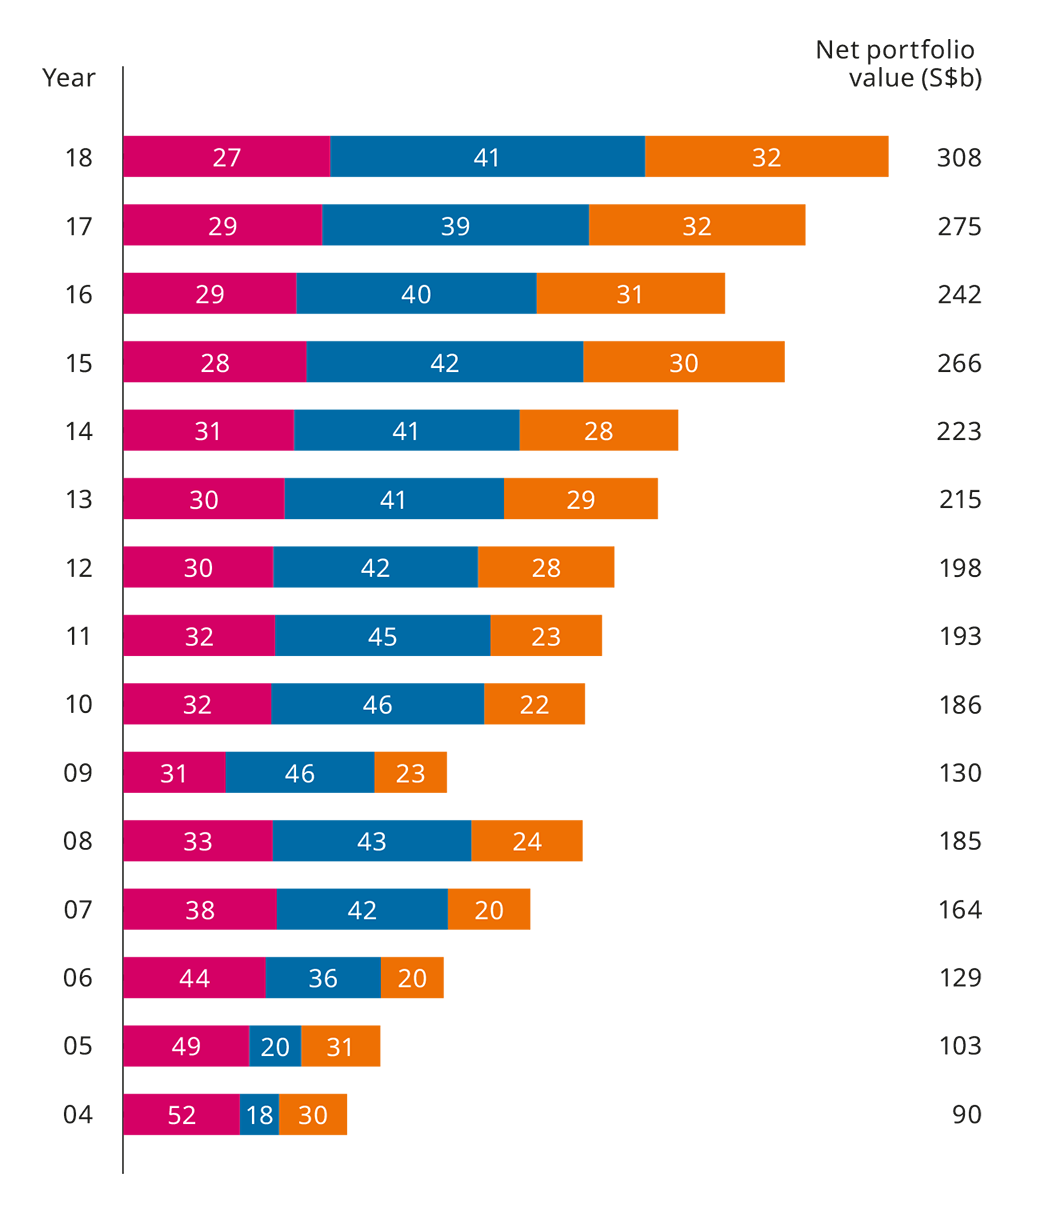
Chart Notes
- Singapore
- Asia ex-Singapore
- Rest of world
Chart Notes
12%
One-year return to shareholder
Total shareholder return of 15% since inception
S$ Total Shareholder Return (%)
Period in years
Period in years

5%
Ten-year return to shareholder
One-year returns of -30% to 43% during the last decade
Rolling S$ Total Shareholder Return (%)

- One-year
- 10-year
- 20-year
S$9b
Dividend income
Average annual dividend income of S$7 billion over the last decade
Dividend Income (S$b)