12-month Returns Outlook
We run Monte Carlo simulations
of our portfolio to give us a sense of the
likelihood of the range of returns in the coming 12
months.
Applied to our current Temasek portfolio mix, our
simulation shows a five-in-six chance that our
one-year portfolio returns may range from -17% to
+24%. Actual annual returns range over -30% to +43%
during the last decade.
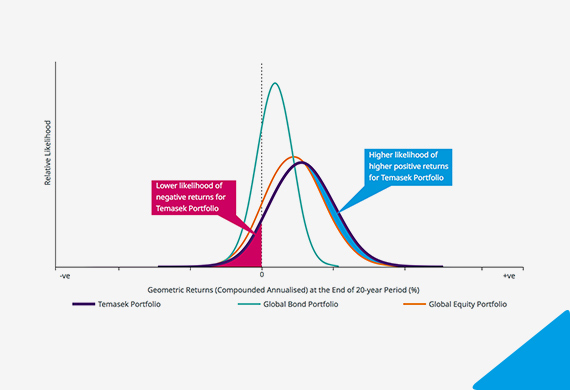
In the chart below, the Monte Carlo simulation
curves represent the likelihood of one-year returns
for some recent financial years. Narrower curves
mean less volatility compared to the flatter curves
of the 2008/09 Global Financial Crisis (GFC) years.
Simulation of 12-month Forward Portfolio Returns
Volatility of Returns
A wider simulated range means a more volatile outlook.
As expected given our portfolio concentration in
equities, our analysis implies that in any given
year, our net portfolio value may see a
once-in-20-years swing of as much as 30% to 40%. We
saw moves of a similar magnitude during the GFC, when our
net portfolio value fell 30% in one year, only to
rebound 43% the next year.
While the global backdrop continues to be supportive
of earnings growth, a number of key risks remain on
the horizon. These include risks of overheating
economies leading to a faster deterioration in the
growth-inflation trade-off, synchronised central bank
tightening in developed markets, as well as
heightened geopolitical risks, including US trade
politics. Depending on the outcome of these events,
a quick escalation in risk and a consequent downturn
in equity markets is a possible scenario. We remain
vigilant and take a proactive approach to managing
these risks.


